Thursday, May 13, 2010
Tuesday, December 05, 2006
I'm Moving

I'm moving over to wordpress.com for the blog. I been trying it out for a while and it's a lot easier to post and upload images to. So stop on over and read up on some tips or tricks.
http://map3d.wordpress.com/
If you want to post a comment over there you need to sign in and have a wordpress account. They are free and so far I don't get any spam or nasty-grams from setting up a free account there.
Friday, November 24, 2006
Display Styles in 2007
The style editor has two parts to it, the top half controls the scale ranges and the bottom half controls the styles for those ranges.
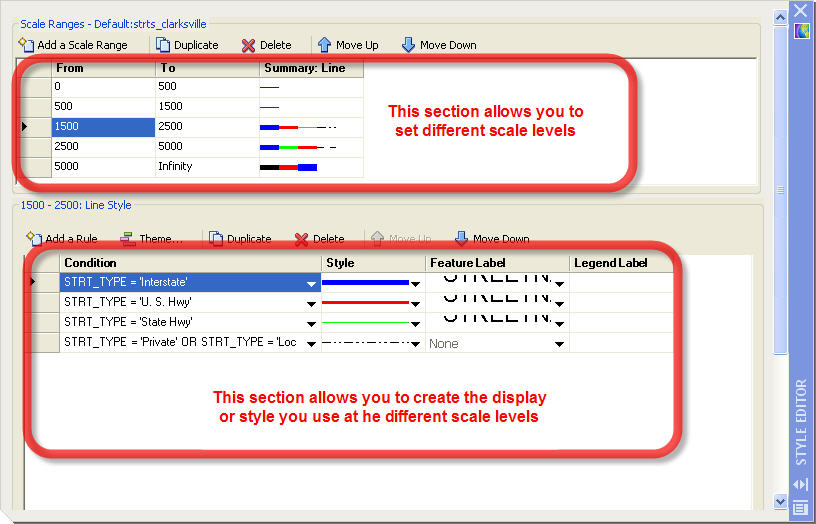
Once you set up the scale ranges you want to use you then create the style for that range. The default is just as it displays when you add the objects to your map either from the data connect or as you draw the AutoCAD objects based on the properties for those objects.
To create a new style you click on the "Add Rule" then select on the "condition" column. This brings up the "Filter" palette that lets you set the condition base on the properties or data value depending on what type of data you are styling.
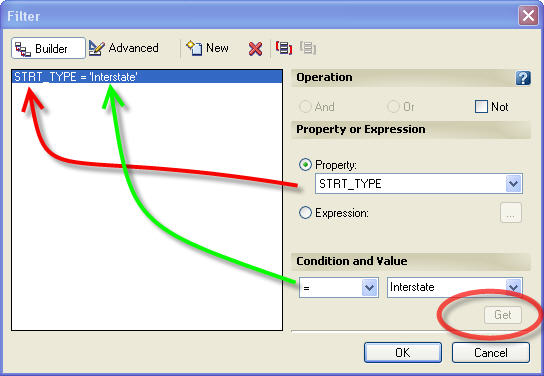
Once you select the property and the condition then click the "GET" button and AutoCAD MAP will provide a list to select from for the value.
You can create compound conditions by clicking on the "NEW" button then select the operation (and, or, not) then set your next condition.

To set a Label Style for that rule, select the rule then click under the column "Feature Label". This will open up the "Style Label" palette that allows you to select what property or field to use for the value of the label and the text/font color, height etc. Be sure you check the "STYLE" box in the top left otherwise the options are grayed out as the default.

Here are the results of setting styles to a simple centerline shape file that I am using with the Data Connect feature.

The nice thing about using these features is I set everything up with out having to import the shp file and having to use layers to control the colors or line types to display the features, and the features change their display as I change the zoom levels while I am editing or viewing the map. Once you create the scale ranges they are available in the task pane under the "Scale 1: XX" button allowing you to zoom right to that scale and the display rules you set for that scale range.

So happy styling until next time.
Friday, November 03, 2006
Data Connect in Map R2007
In this example I will connect to a folder of shp files and go though the steps of connecting and displaying the features of those files. To start click on the Data -Add Data icon on the Map Task Pane, this opens up the data connect palette.
The format that you can connect to is listed on the left side of the palette. Click on the format you want to connect with. The options or methods of connections vary depending on what format of files you select on the left side of the palette. This example I am connecting to shp format so all that is displayed it the name and paths to those file(s) For the connection name call it what you want, but keep it simple and later when you create a legend for you map this connection name may end up being the title for that legend. (more on that later). For the source file or folder you have two options either a connection to a single file or to a folder of files. You can browse to the file or folder by clicking on the icons.
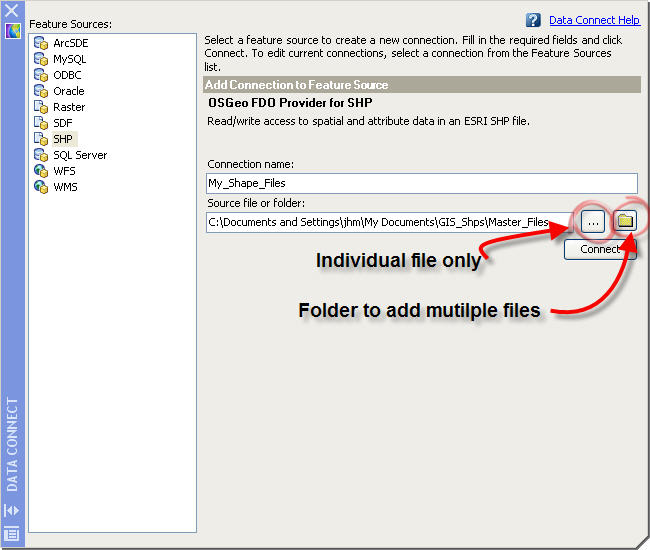
Once you select the folder/file click on the connect button.
The palette now displays the list of files in the folder or the single file if you selected only one file. This is where you select the file(s) to add to your map. You can select only the files you want if you are connecting to a folder. Place a check mark in the box to the file you want. Then click on the Add to Map button at the bottom of the palette.

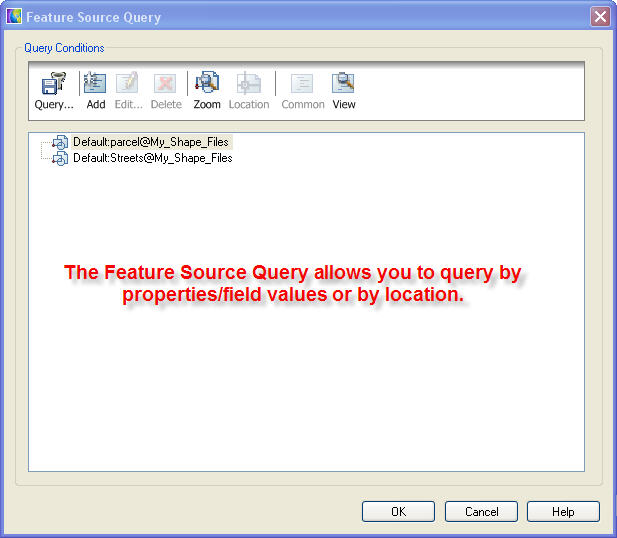
The next palette displayed allows you to perform a query on the data to add to the map, much like when you use the import command. You can query on location or by values of the feature data. Click the OK button.
After a few seconds or longer depending on the size of the files and your workstation the features are displayed in the map.
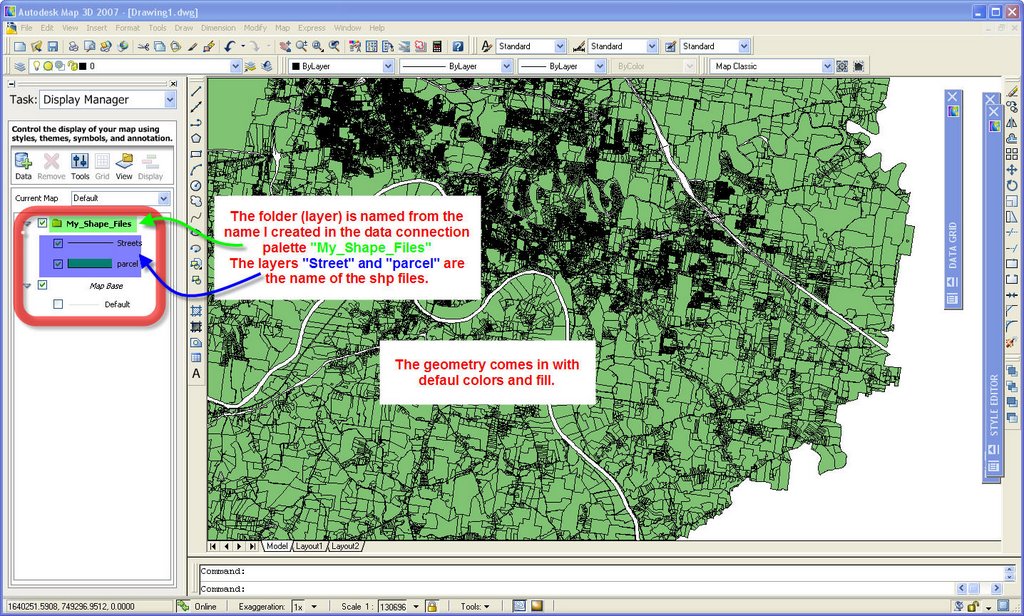
In the Map Task Pane in the Display Manager you will have what AutoDesk MAP is calling layers displayed. This is similar to the Table of Contents with the ESRI products or other GIS systems. Keep in mind this is only a name used in the display manger and should not be confused with the AutoDesk LAYERS that are a property of AutoCAD entities.
So now that you are connected and have added the features data of another format you can change the way they are displayed by using the Style Editor for that layer. To change the way a feature layer is displayed, select the layer in the Display Manger, right click and select Edit Display Style. This opens up the style editor palette that allows you to edit how those features are to be displayed and at what scales.
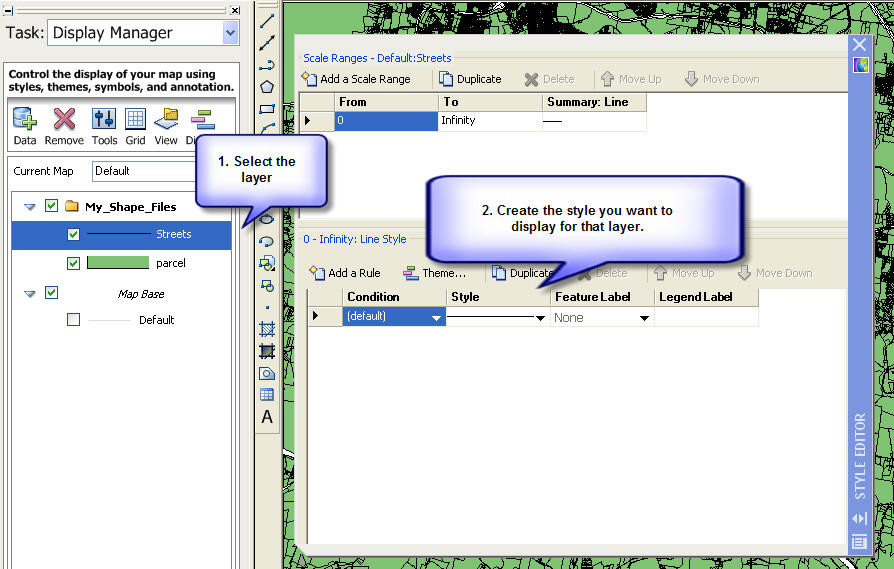
The top half of the palette controls the scale display and the bottom half controls the style. The editor allows you to display the features with different styles at different scales at zoom levels. With this example I will set a few styles for my parcels and street layers.
First we change the color of the street layer to RED, then change the pattern of the parcels layer. To edit the style used, click on the swatch(hatch) or line under the style column.

This opens a palette to allow you to select the color, line type and etc. for that style. Make sure you check the Apply style to the line check box at the top of the palette.

For the parcel layer, which is a polygon layer you can select the fill pattern along with a border to display and transparency for the foreground fill.
Now that we styled the map features take a look at what I have displayed.
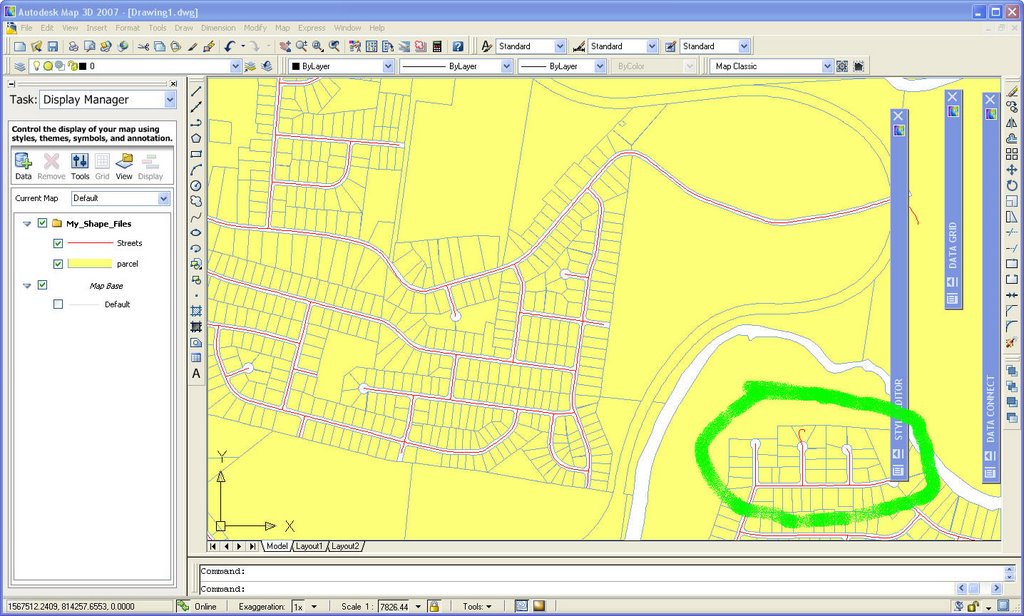
Notice that I have a street centerline that does not match up with the parcels in the area circled in green. The next posting I will go over some ways to edit that and make the corrections with out having to import, edit in Map, and export it back to the shp file format. You can edit and correct everything right in the data connect mode. So check back in a few days and hopefully I will have a few tips on using these features in Map 3D R
Wednesday, October 25, 2006
Oh Great another dead blog.... NOT
I do have one big complaint about the folks up here in Manchester, NH., the ISD HQ for Auto Desk. Where in heck can man get a good beer? Four nights out at 4 different places and none of them have Pabst Blue Ribbon Beer? Not even the Hilton I'm staying in has it and it is next to a baseball field, America's favorite past time and no PBR. I wish there was a Motel 6 with a dinner around the corner cause they would definitely have a Blue Ribbon.
OK back to useful stuff, I'm working on doing a short example of using the Data Connect in Map 2007 and showing some ways it can be of use to others out there that have data in that other format. I'm also working on getting contours from a DEM and exporting(saving) it to a ESRI shp format with R2007.
Stay tuned I promise to be back with some good info in the next few days.
Saturday, September 09, 2006
Contours from a DEM file to a SHP file with MAP 3D
This post will be a quick walk-thru on doing it with some screen shots to help you. To start bring in the DEM as a surface.
From the pull-down menu under "Civil-Surface-Create From DEM"
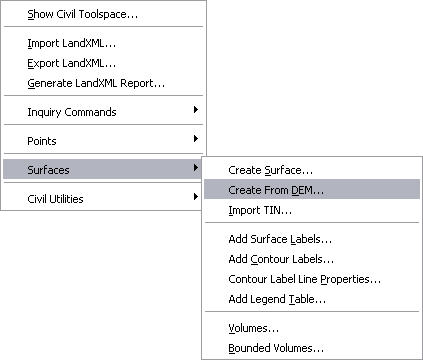
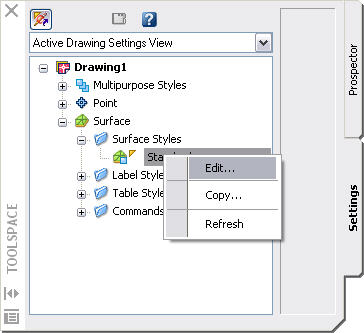
Browse to where the DEM file is located and select it. In a matter of seconds a new surface is created in MAP. Zoom extends and all you may see is a yellow rectangle. The reason you do not see anything is you may not have the styles for the surfaces set to display the objects(contours). The default display for civil surfaces in MAP is to show the border only for 2D display and triangles for 3D display. Open up the Civil Toolspace and click on the “Settings” tab. Expand the surface tree to show the Surface Style Standard. Right click on the standard style and click on edit.
The Style editor dialog will open, for that surface style. The first thing we need to tell MAP 3D is the contour intervals we want it to display. Click on the Contour tab at the top then expand the tree under Contour Intervals.
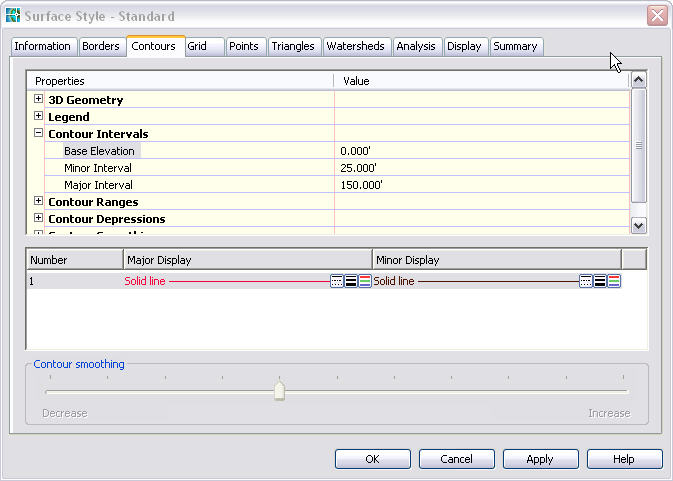
Set the Minor Interval to 25.00' and the Major Interval to 150.00'. Keep the Base Elevation at 0.00'.
Next click on the Display tab so MAP 3D knows will know how we want them displayed.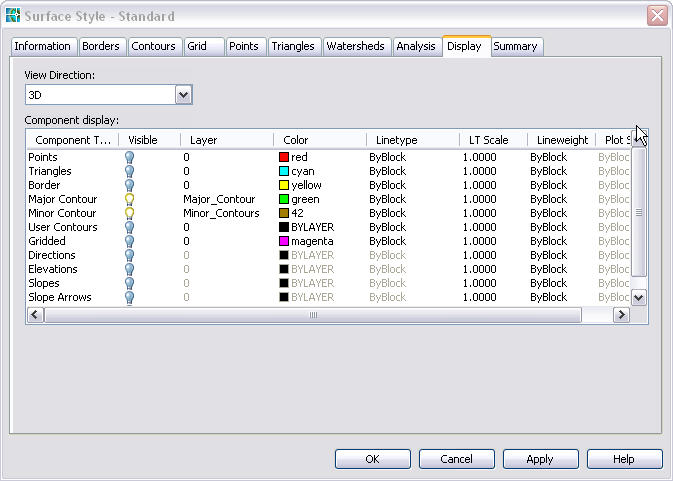
In the View Direction select 3D. Set the Triangles as invisible and Major Contours & Minor Contours as Visible by clicking on the light bulb icon. Next put the contours on their own layers by clicking under the layer for each and select a layer or create a new layer for each. Next you can check that the same settings are there under the View Direction for 2D by switching the 3D to 2D in the View Direction list box. Click apply and OK.
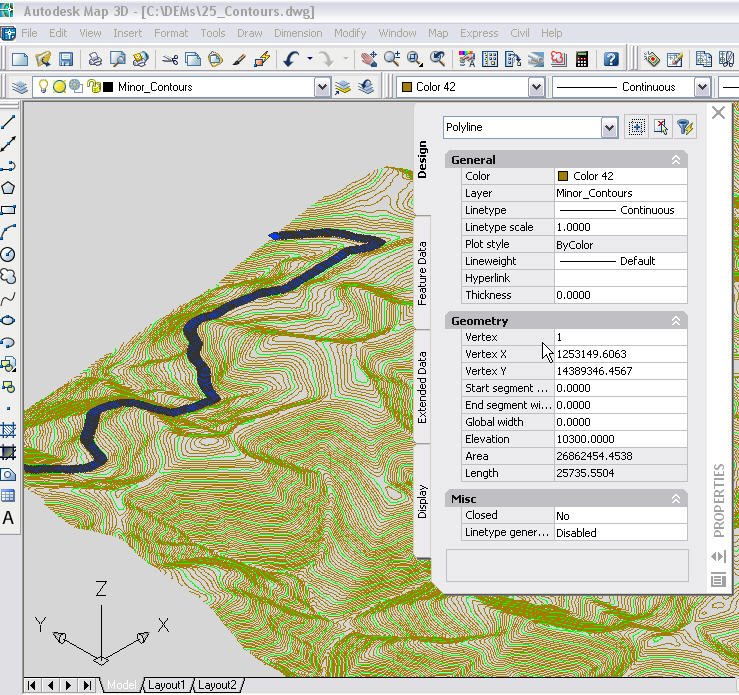
Map takes a few minutes to create and display the contour lines. They should be at the intervals you set and displayed by the color specified in the style editor not by the layer color. Now that you have the contours displayed you may notice they are not polylines but a single object. A Civil object at that, so we need to convert them into polylines to export to a shp file.
To convert them the first thing I like to do is change my view of them to a 3D view. Using the standard AutoCAD view menu switch to a 3D view (SW Isometric). After MAP rescans the surface you should see that the contours are at the correct elevations. This is a good tip to verify that the DEM was converted to a surface and displays the contours as you wanted. Then next step is to Export the surface to a AutoCAD dwg.
Under the Civil menu, select Civil Utilities>Export to AutoCAD>2004 format.

Save the exported dwg to the folder of your choice. After the export is complete open the dwg that you just created. It should be in the same 3D view as the surface when you exported it, again this is a tip to check and see that you have what you need for the shp file. There is no need to change the view in the new dwg. If you select a contour line, you will notice it is a polyline on the layer you set in the style editor and at the correct elevation.
Now you have the correct objects to Export to a ESRI shp file. When you export it you can export the layer and elevations from the properties to include those in the shp file data.
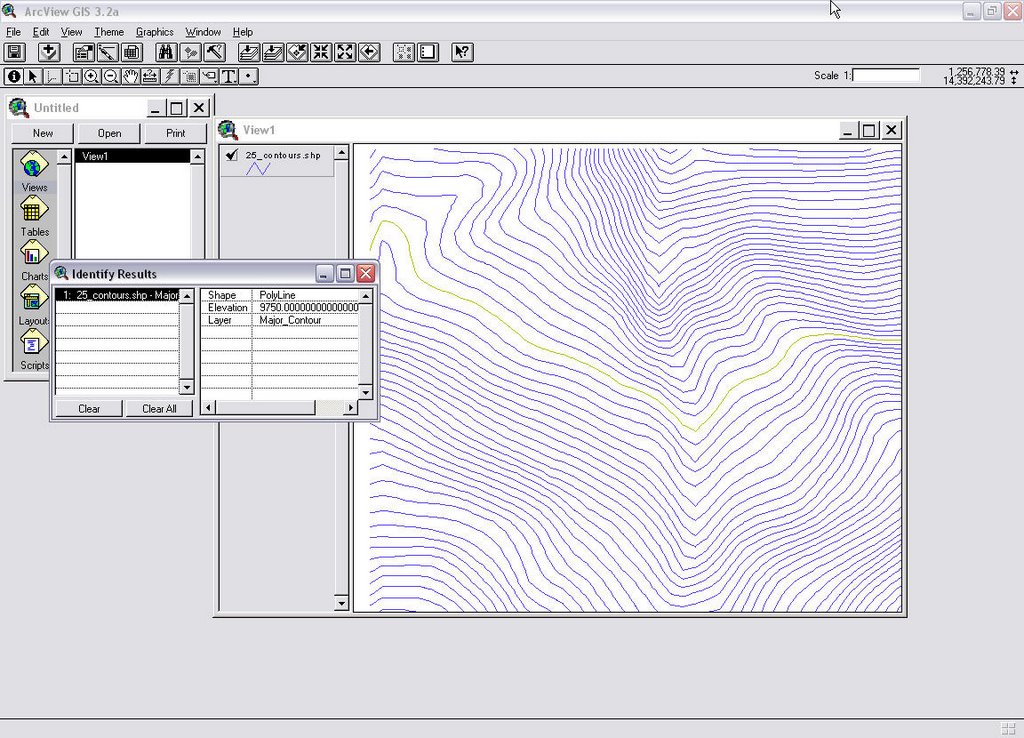
As you can see the contours lines with the elevations and layers are there in a ESRI table so anyone can now use the DEM file as contours in their GIS system.
Note this example was done using Map 3D 2006, the civil tools in Map 3D 2007 are different but I 'll try to post the how-do with R2007 in a few weeks.
An another item to be aware of, when you set the value for the contour intervals keep in mind the smaller the intervals the more there are and the bigger the file becomes then the longer it takes to rescan and redraw the surface.
Thursday, August 31, 2006
Amazing conference
What I am most shocked at is the users forgot about AutoCAD and how to use it. As I said most of them used it to VIEW drawings only. They have no idea of how to get new parcels into an ESRI GIS system or that the newest versions can make the task simple. So come on people if you are a former AutoDesk shop that switched to ESRI keep up with the software. The cost of just one subscription of AutoDesk MAP will pay for it's self with the time saved on trying to redraw those subdivisions plots you get from the developers.