The style editor has two parts to it, the top half controls the scale ranges and the bottom half controls the styles for those ranges.
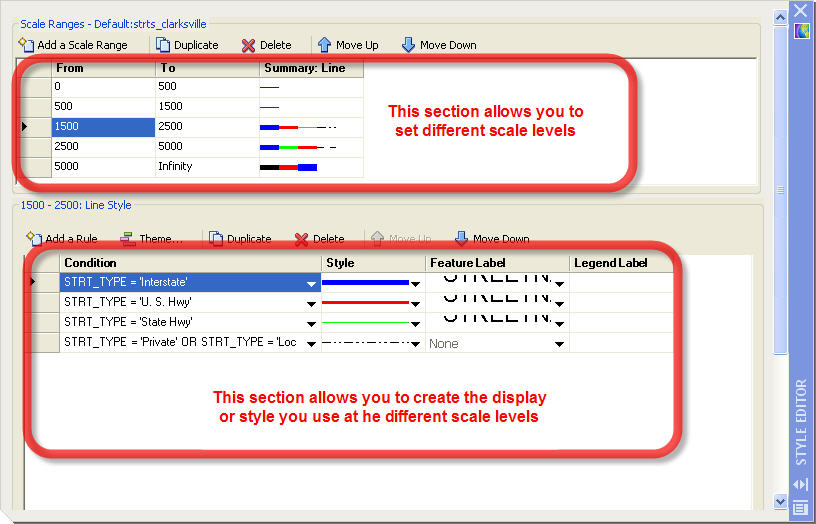
Once you set up the scale ranges you want to use you then create the style for that range. The default is just as it displays when you add the objects to your map either from the data connect or as you draw the AutoCAD objects based on the properties for those objects.
To create a new style you click on the "Add Rule" then select on the "condition" column. This brings up the "Filter" palette that lets you set the condition base on the properties or data value depending on what type of data you are styling.
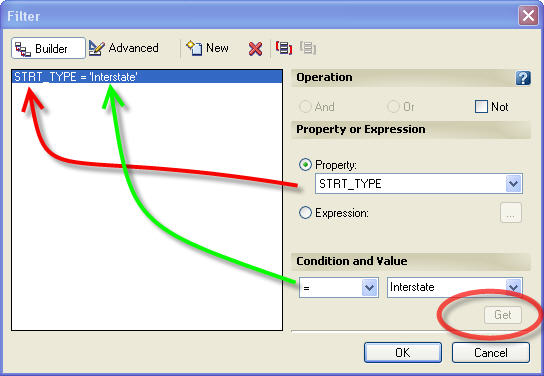
Once you select the property and the condition then click the "GET" button and AutoCAD MAP will provide a list to select from for the value.
You can create compound conditions by clicking on the "NEW" button then select the operation (and, or, not) then set your next condition.

To set a Label Style for that rule, select the rule then click under the column "Feature Label". This will open up the "Style Label" palette that allows you to select what property or field to use for the value of the label and the text/font color, height etc. Be sure you check the "STYLE" box in the top left otherwise the options are grayed out as the default.

Here are the results of setting styles to a simple centerline shape file that I am using with the Data Connect feature.

The nice thing about using these features is I set everything up with out having to import the shp file and having to use layers to control the colors or line types to display the features, and the features change their display as I change the zoom levels while I am editing or viewing the map. Once you create the scale ranges they are available in the task pane under the "Scale 1: XX" button allowing you to zoom right to that scale and the display rules you set for that scale range.

So happy styling until next time.
No comments:
Post a Comment