So what’s this Data Connect thing in Map 2007 you ask? Well in a nut shell it’s a way to connect to other GIS Systems file formats.
Not only connect and view the data attached to those files but also
allows you to edit those files and save them back to their naive format with out doing an import and export.In this example I will connect to a folder of shp files and go though the steps of connecting and displaying the features of those files. To start click on the
Data -Add Data icon on the Map Task Pane, this opens up the data connect palette.
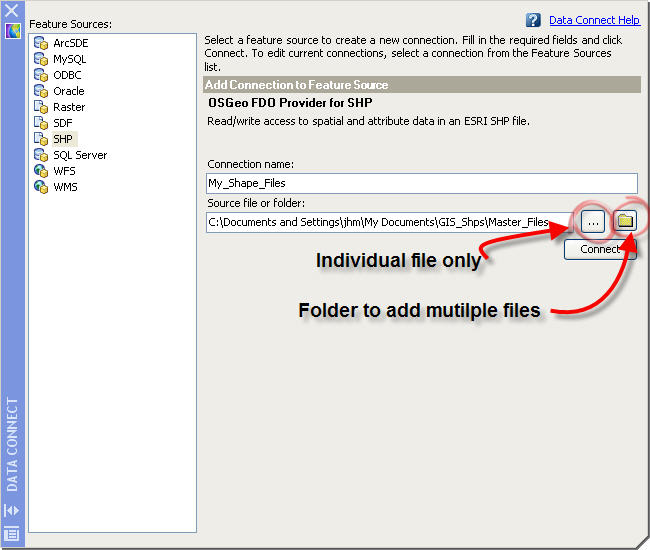
The format that you can connect to is listed on the left side of the palette. Click on the format you want to connect with. The options or methods of connections vary depending on what format of files you select on the left side of the palette. This example I am connecting to shp format so all that is displayed it the name and paths to those file(s) For the connection name call it what you want, but keep it simple and later when you create a legend for you map this connection name may end up being the title for that legend. (more on that later). For the source file or folder you have two options either a connection to a single file or to a folder of files. You can browse to the file or folder by clicking on the icons.
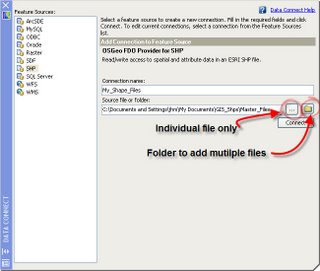
Once you select the folder/file click on the
connect button.
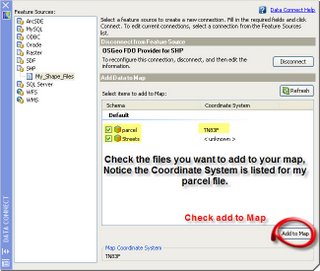
The palette now displays the list of files in the folder or the single file if you selected only one file. This is where you select the file(s) to add to your map. You can select only the files you want if you are connecting to a folder. Place a check mark in the box to the file you want. Then click on the
Add to Map button at the bottom of the palette.
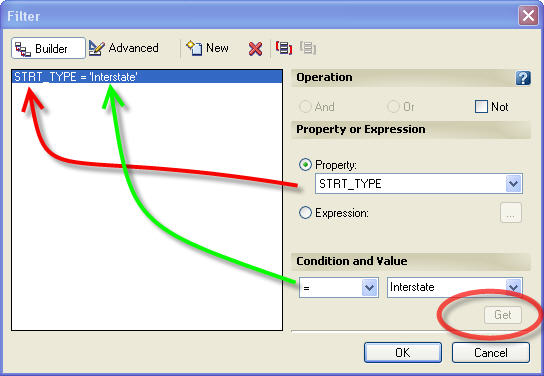
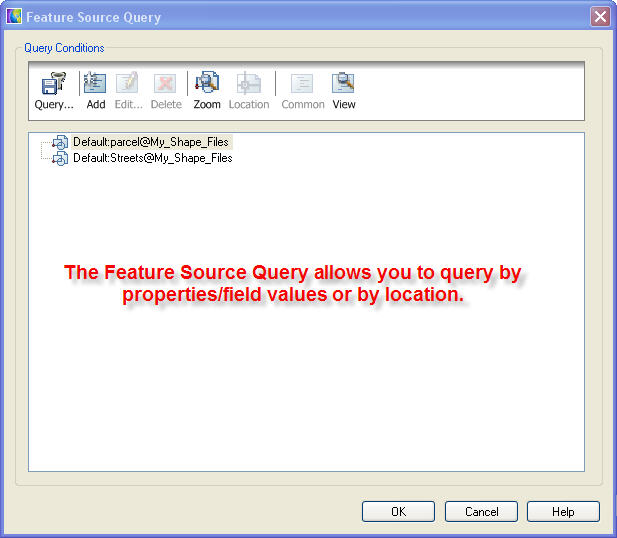
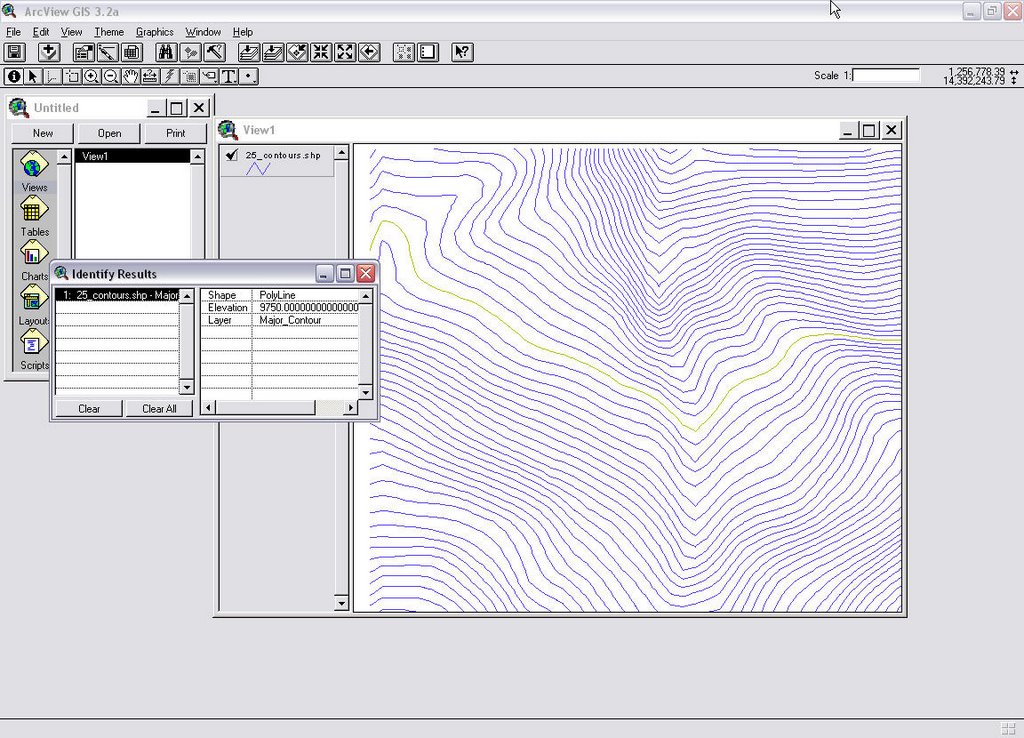
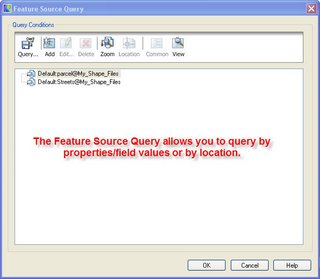
The next palette displayed allows you to perform a query on the data to add to the map, much like when you use the import command. You can query on location or by values of the feature data. Click the OK button.
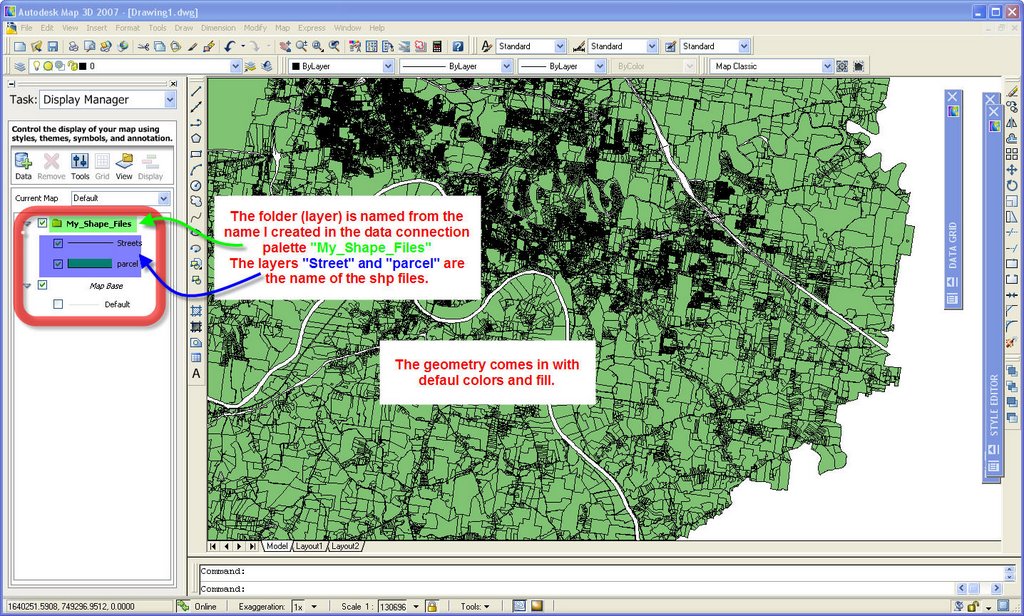
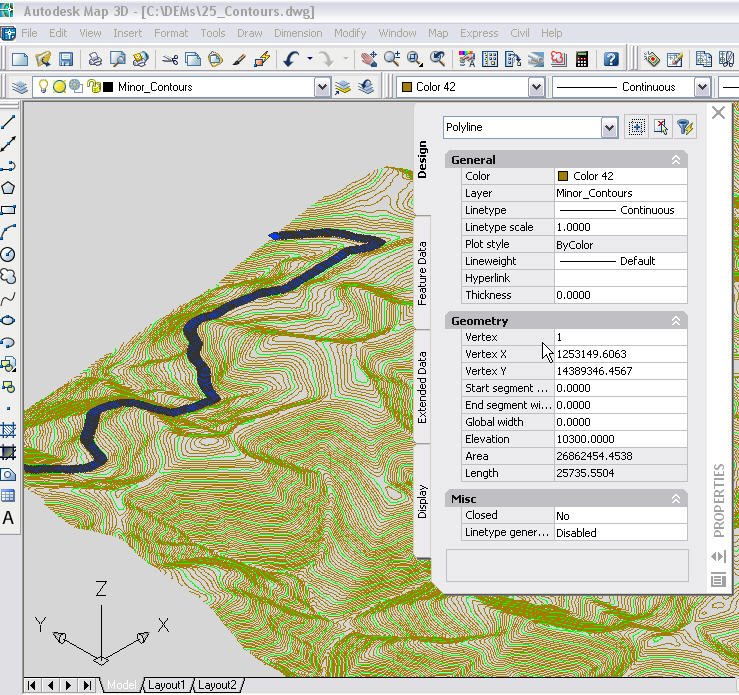
After a few seconds or longer depending on the size of the files and your workstation the features are displayed in the map.
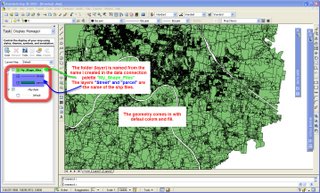
In the Map Task Pane in the Display Manager you will have what AutoDesk MAP is calling layers displayed. This is similar to the Table of Contents with the ESRI products or other GIS systems. Keep in mind this is only a name used in the display manger and
should not be confused with the AutoDesk LAYERS that are a property of AutoCAD entities.
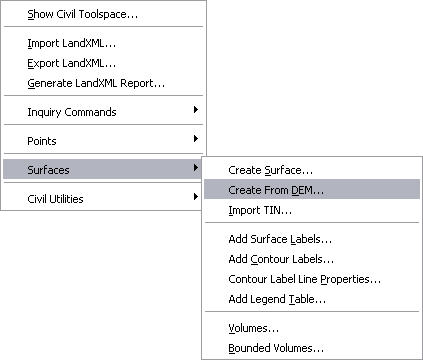
So now that you are connected and have added the features data of another format you can change the way they are displayed by using the
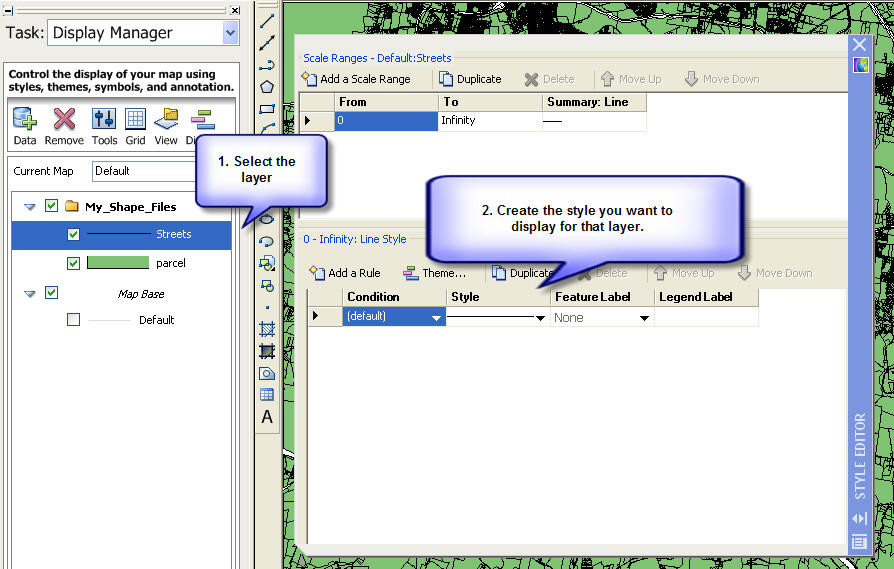
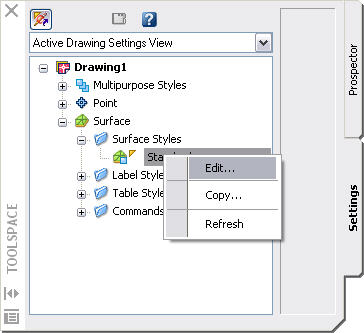
Style Editor for that layer. To change the way a feature layer is displayed, select the layer in the Display Manger, right click and select
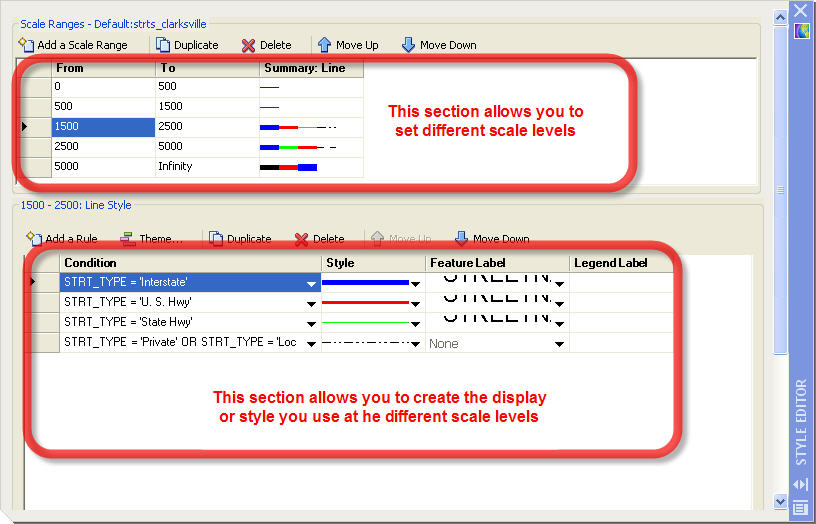
Edit Display Style. This opens up the style editor palette that allows you to edit how those features are to be displayed and at what scales.
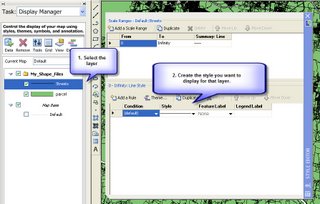
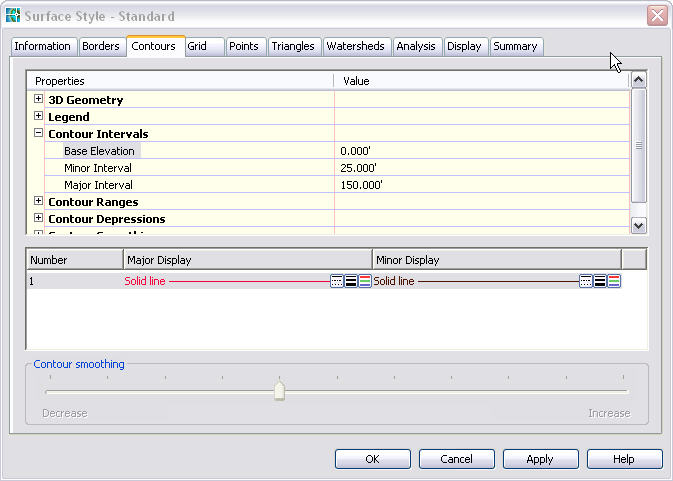
The top half of the palette controls the scale display and the bottom half controls the style. The editor allows you to display the features with different styles at different scales at zoom levels. With this example I will set a few styles for my parcels and street layers.
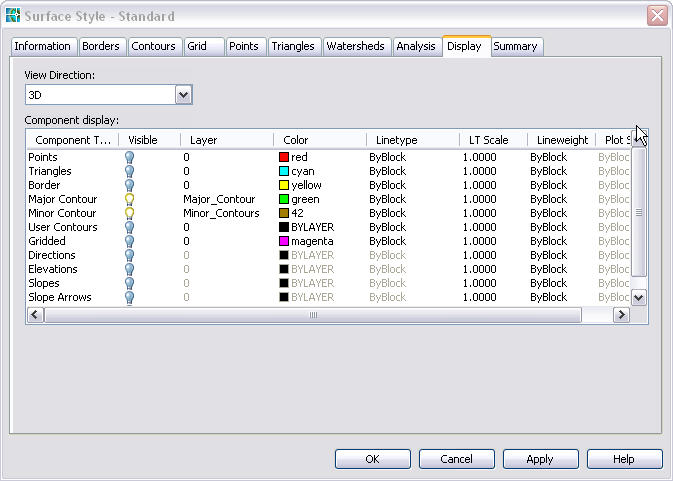
First we change the color of the street layer to RED, then change the pattern of the parcels layer. To edit the style used, click on the
swatch(hatch) or line under the style column.
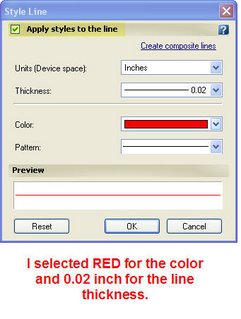
This opens a palette to allow you to select the color, line type and etc. for that style. Make sure you check the
Apply style to the line check box at the top of the palette.
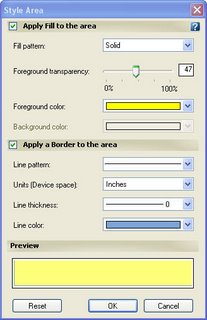
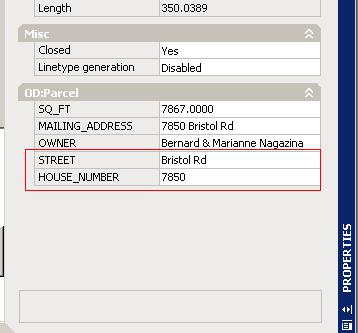
For the parcel layer, which is a polygon layer you can select the fill pattern along with a border to display and transparency for the foreground fill.
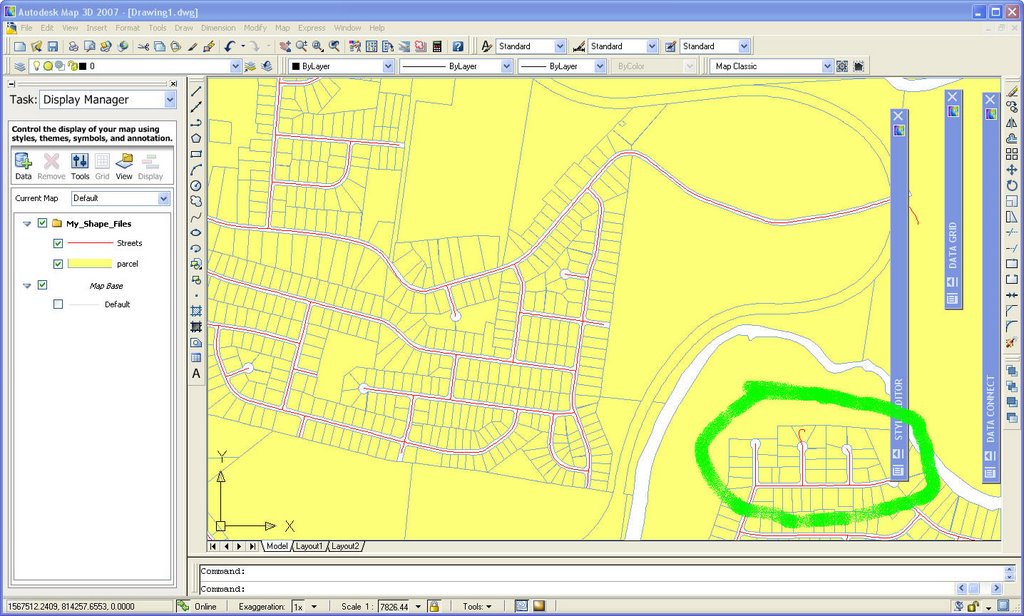
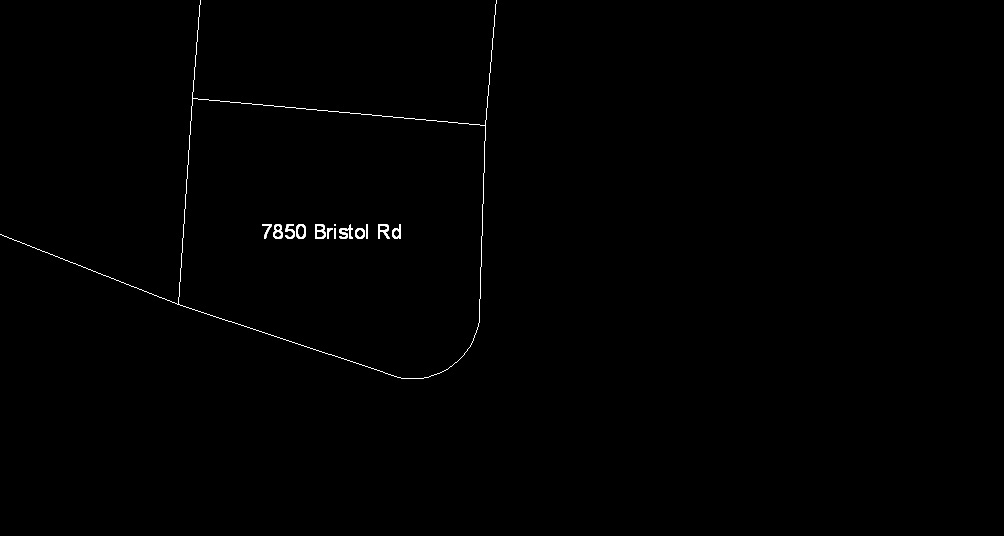
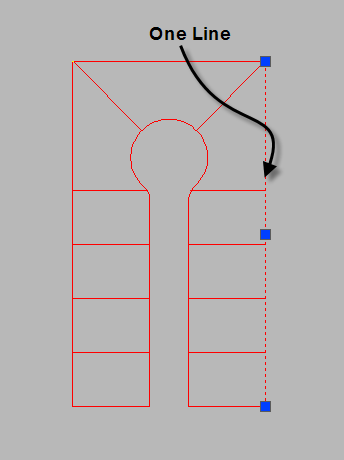
Now that we styled the map features take a look at what I have displayed.
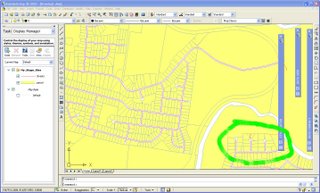
Notice that I have a street centerline that does not match up with the parcels in the area circled in green. The next posting I will go over some ways to edit that and make the corrections with out having to import, edit in Map, and export it back to the shp file format. You can edit and correct everything right in the data connect mode. So check back in a few days and hopefully I will have a few tips on using these features in Map 3D R